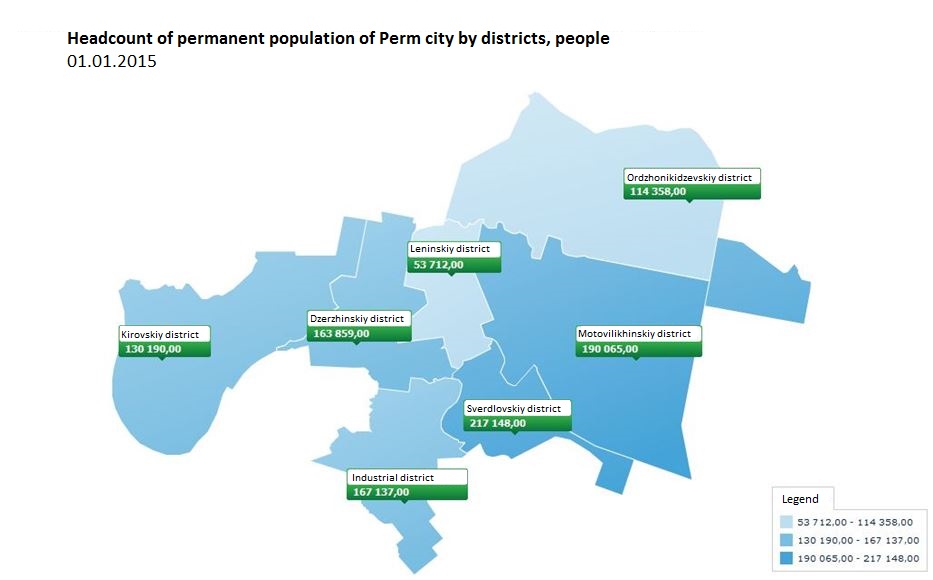
Population of Perm city
As of the 1st of January 2015 the population is 1 036 469 people.
DIAG
Perm city includes territories of Dzerzhinskiy, Industrial, Kirovskiy, Leninskiy, Motovilihinskiy, Ordzhonikidzevskiy and Sverdlovskiy districts, being intra-urban administrative-territorial units.
Monetary incomes of Perm population
Payroll fund of large and medium-sized enterprises of the city as per the results of 2014 is 128,4 bln. rubles, having increased by 8,6 % or by 10,2 bln. rubles as compared to 2013.
Contribution of the main types of economic activity to the growth rate of payroll fund
|
Type of activity |
Payroll fund, mln. rubles |
|||
|---|---|---|---|---|
|
2013 |
2014 |
Growth rate, % |
Contribution to growth rate, % |
|
|
In total in Perm city |
118 168,0 |
128 371,2 |
108,6 |
8,6* |
|
Agriculture, hunting and forestry |
97,8 |
149,8 |
153,1 |
0,04 |
|
Extraction of mineral resources |
1 226,7 |
1 444,9 |
117,8 |
0,18 |
|
Processing productions |
32 652,6 |
35 413,5 |
108,5 |
2,33 |
|
Production and distribution of electricity, gas and water |
4 977,2 |
5 257,9 |
105,6 |
0,24 |
|
Construction |
4 083,2 |
4 477,7 |
109,7 |
0,33 |
|
Wholesale and retail trade |
6 078,1 |
7 451,5 |
122,6 |
1,16 |
|
Hotels and restaurants |
437,2 |
516,6 |
118,2 |
0,07 |
|
Transport and communication |
10 212,8 |
10 631,4 |
104,1 |
0,35 |
|
Financial activity |
8 082,9 |
8 684,9 |
107,4 |
0,51 |
|
Operations with immovable property |
13 226,1 |
14 062,7 |
106,3 |
0,71 |
|
State management and ensuring military security; social insurance |
15 041,3 |
15 783,9 |
104,9 |
0,63 |
|
Education |
10 249,9 |
11 138,6 |
108,7 |
0,75 |
|
Healthcare and social services |
9 471,0 |
10 608,4 |
112,0 |
0,96 |
|
Rendering other communal, social and personal services |
2 319,8 |
2 740,2 |
118,1 |
0,35 |
* increase of payroll fund in 2014
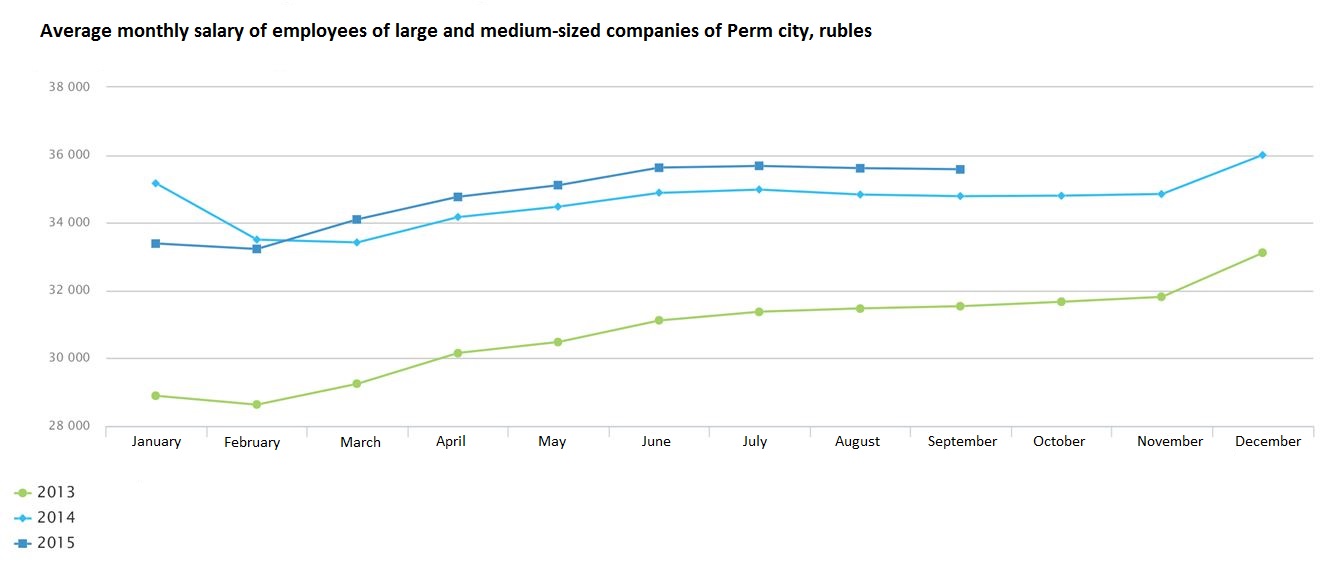
Average monthly salary of large and medium-sized enterprises of the city employees was 35 991,8 rub. in January-December 2014 or 108,6 % to January-December 2013.
Average monthly salary in calculation for one employee as per the types of activity
|
Indicators |
2014 |
2014 in % to 2013. |
|---|---|---|
|
In total, rubles |
35991,8 |
108,6 |
|
Agriculture, hunting and forestry |
26839,0 |
105,0 |
|
Fishing, fishery |
29409,0 |
96,1 |
|
Extraction of mineral resources |
64093,3 |
115,7 |
|
Processing productions |
34137,5 |
109,9 |
|
Production and distribution of electricity, gas and water |
36486,7 |
109,4 |
|
Construction |
30203,5 |
105,3 |
|
Wholesale and retail trade; repair of automotive vehicles, motorcycles, household |
27646,6 |
112,4 |
|
Hotels and restaurants |
21437,6 |
109,2 |
|
Transport and communication |
32727,5 |
105,6 |
|
Financial activity |
59349,5 |
117,2 |
|
Operations with immovable property, lease and rendering services |
44431,0 |
107,3 |
|
State management and ensuring military security; social insurance |
44148,9 |
103,9 |
|
Education |
29209,8 |
109,5 |
|
Healthcare and rendering social services |
30469,4 |
110,8 |
|
Rendering other communal, social and personal services |
30017,0 |
114,7 |
Perm occupies the 2nd place after Ekaterinburg as per the size of average monthly salary in 2014 among the cities-analogues, the same as during the previous years.
Headcount of those people, who work at large and medium-sized enterprises has been 313 150 people in 2014, 27,8% of them work at the enterprises of processing production, 11,2% in education, 10% in healthcare sphere.
Perm city population employment pattern as per the types of activity:
|
Name of branch |
Headcount of employed people, by branches 2014, people |
Portion of employed people in the total headcount, by branches, % |
in % to 2013. |
|---|---|---|---|
|
Headcount of those people, who work at large and medium-sized enterprises-in total, people. |
313 150 |
100,0 |
99,7 |
|
Extraction of mineral resources |
1 908 |
0,6 |
103,2 |
|
Processing productions |
87 093 |
27,8 |
98,5 |
|
Production and distribution of electricity, gas and water |
12 175 |
3,9 |
96,6 |
|
Construction |
12 539 |
4,0 |
104,3 |
|
Wholesale and retail trade |
22 762 |
7,3 |
109,1 |
|
Hotels and restaurants |
2 097 |
0,7 |
109,4 |
|
Transport and communication |
27 546 |
8,8 |
98,8 |
|
Financial activity |
14 602 |
4,7 |
89,9 |
|
Operations with immovable property |
27 217 |
8,7 |
98,9 |
|
State management and ensuring military security; social insurance |
30 155 |
9,6 |
100,0 |
|
Education |
34 909 |
11,2 |
99,1 |
|
Healthcare and social services |
31 310 |
10,0 |
101,2 |
|
Rendering other services |
8 331 |
2,7 |
103,0 |